How to Track Audio Plays in Google Analytics 4
Google Analytics 4 can tell you which pages people visit, but it does not track audio plays on its own. If you want to know how many visitors press play, how far they listen and which tracks they finish, you need to send that information yourself. This guide shows a simple, privacy-friendly way to do it with a few lines of JavaScript.
Table of Contents
Why GA4 does not track audio plays automatically
GA4’s enhanced measurement records page views, scrolls, outbound clicks, file downloads and engagement with embedded YouTube videos. It does not listen to the HTML5 <audio> element. Without extra code, a visitor who listens to a whole podcast episode looks exactly the same in your reports as one who never pressed play.
What to measure
Keep the list short. Three events answer most questions:
| Event name | When it is sent | What it tells you |
|---|---|---|
audio_start | The first time a track starts playing | How many visitors try the audio |
audio_progress | At 25%, 50% and 75% of the track | Where people stop listening |
audio_complete | When the track reaches the end | How many listen to the end |
Each event carries the track title, so you can compare tracks or episodes in your reports.
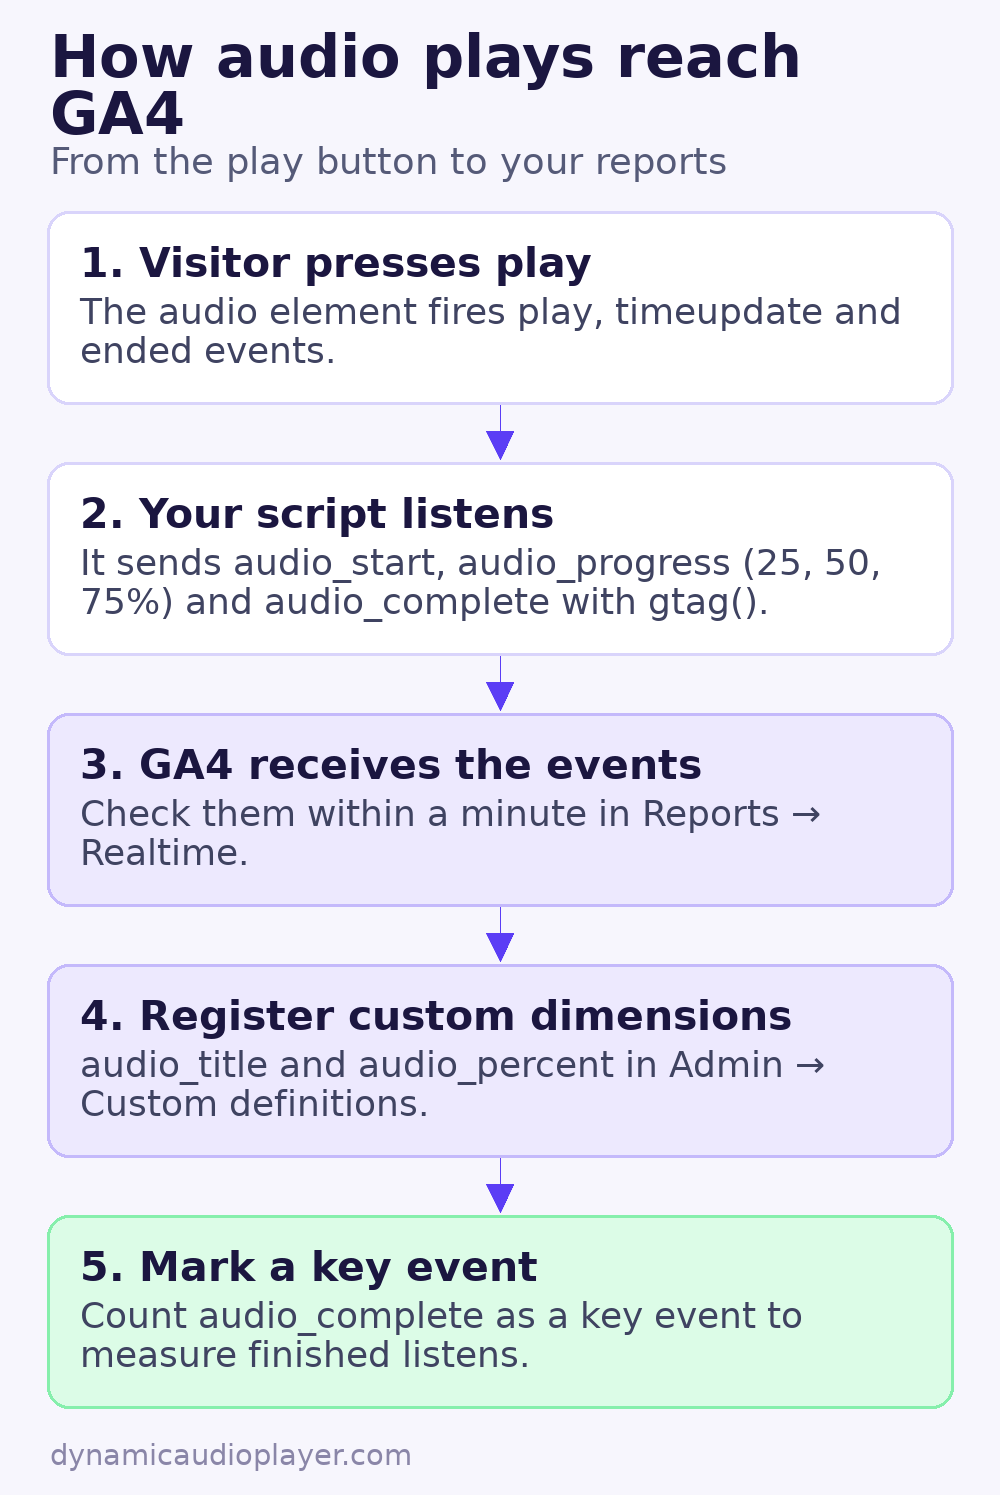
Step 1: make sure GA4 is installed
The script below uses the gtag() function that the standard Google tag adds to your pages. Check that your site already has the GA4 tag, with a measurement ID that starts with G-. If you use Google Tag Manager instead, see the note further down.
Step 2: give each player a title
Add a data-title attribute so your reports show a readable name instead of a file name:
<audio controls preload="metadata"
       src="/media/episode-12.mp3"
       data-title="Episode 12: Recording at home"></audio>
Step 3: add the tracking script
Place this script near the end of the page, or in a file that loads on every page with audio. It works with any number of players on the page.
<script>
document.querySelectorAll('audio').forEach((audio) => {
  const title = audio.dataset.title || audio.currentSrc.split('/').pop();
  const sent = new Set();

  const send = (name, extra = {}) => {
    if (typeof gtag === 'function') {
      gtag('event', name, { audio_title: title, ...extra });
    }
  };

  audio.addEventListener('play', () => {
    if (!sent.has('start')) { sent.add('start'); send('audio_start'); }
  });

  audio.addEventListener('timeupdate', () => {
    if (!audio.duration) return;
    const percent = Math.floor(audio.currentTime / audio.duration * 100);
    [25, 50, 75].forEach((mark) => {
      if (percent >= mark && !sent.has(mark)) {
        sent.add(mark);
        send('audio_progress', { audio_percent: mark });
      }
    });
  });

  audio.addEventListener('ended', () => send('audio_complete'));
});
</script>
The sent set makes sure each milestone is reported only once per page view, even if the visitor pauses and resumes. Players added to the page later, for example by a script that loads more episodes, need the same listeners attached when they appear.
Step 4: register the custom parameters
GA4 receives audio_title and audio_percent straight away, but it only shows them in standard reports after you register them:
- In GA4, open Admin → Data display → Custom definitions.
- Click Create custom dimension, choose the Event scope and enter
audio_titleas the event parameter. - Repeat for
audio_percent.
New custom dimensions only apply to data collected after you create them, so set them up before you rely on the numbers.
Step 5: check that events arrive
- Open your site in a private window and play a track for a few seconds.
- In GA4, go to Reports → Realtime. The events appear in the “Event count by event name” card within a minute or so.
- After a day, open Reports → Engagement → Events to see totals for each event.
If you want to count finished listens as a goal, open Admin → Data display → Events and mark audio_complete as a key event.
How to read the results
Once a week or two of data has arrived, a few simple comparisons are more useful than any single number:
- Start rate: divide
audio_startevents by the page views of pages with a player. A low rate often means the player is too far down the page or its purpose is unclear. - Drop-off: compare the counts for 25%, 50% and 75%. A big drop early in a podcast suggests the introduction is too long.
- Completion by track: use the
audio_titledimension in an Exploration report to see which episodes or songs people finish most often.
In Explore, a free-form exploration with the event name and audio_title as dimensions, and event count as the metric, shows all of this in one table.
Using Google Tag Manager instead
With Tag Manager, keep the same script but replace the gtag('event', …) call with dataLayer.push({ event: name, audio_title: title, ...extra }). Then create a GA4 event tag that fires on a custom event trigger for each event name.
Keep it privacy-friendly
- Never put names, email addresses or other personal data in event parameters. GA4’s terms do not allow it.
- Keep event and parameter names short: GA4 accepts up to 40 characters for names and 100 characters for parameter values.
- Mention audio analytics in your privacy policy if you list what Google Analytics measures.
Common questions
Can I track audio plays from SoundCloud or Spotify embeds?
Not with this script. Embedded players run inside an iframe from another domain, so your page cannot see their play button. Use the statistics that the platform provides instead.
Will this track audio plays from visitors who block analytics?
No. If a visitor blocks Google Analytics or declines cookies, the events are not sent. Treat the numbers as a trend, not an exact count.
Does tracking slow down the player?
No. The listeners only run a tiny calculation while the audio plays, and each event is a small request sent in the background.
Related guides:
- The HTML5 audio element guide
- How to add a podcast player to your website
- Audio not playing? Common causes and fixes